Running a system continuously changes the kinds of questions you ask. Instead of focusing on features or throughput, attention shifts to failure modes, recovery behavior, and whether you actually have the signals needed to understand what is happening when something goes wrong.
Before diving into the operational lessons, it’s worth explaining why I ran this experiment in the first place and what I wanted to learn from it.
Why I ran this experiment
For the last couple of months, I have been building my own edge IoT gateway. What started as upskilling in IoT, gradually evolved into a deeper exploration of systems programming and embedded development, primarily using Rust on a STM32 IoT discovery kit (B-L475E-IOT01A).
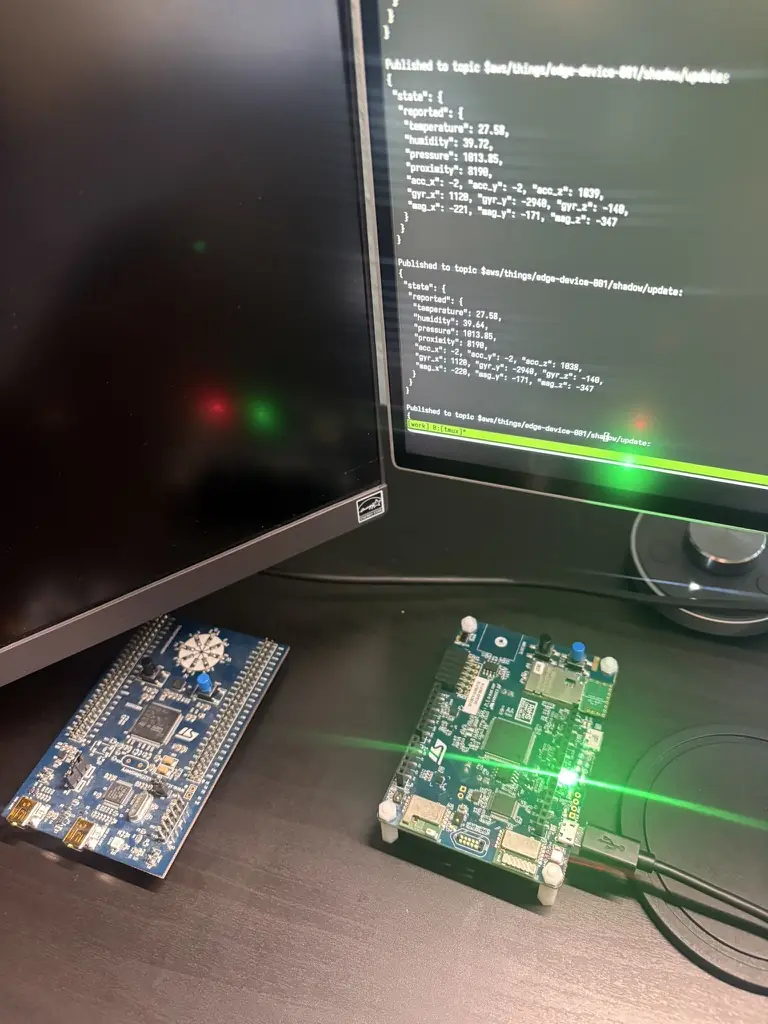
To ground this work in reality, I didn’t stop at writing firmware or running local demos. I set up and operated a complete firmware lifecycle on a physical device, including secure boot, signed firmware images, over-the-air (OTA) updates, and continuous sensor data ingestion into AWS IoT in the cloud. The system was then run continuously, as if it were a production deployment.
Once the device was deployed and left running continuously, the questions changed. It was no longer about “does it compile?” or “does it work once?”, but rather “what breaks silently?” and “what would I miss without proper observability?”.
The goal was not to build a polished demo. It was to observe how a real edge system behaves under realistic conditions: partial failures, unexpected restarts, delayed delivery, and unreliable networks — the kind of conditions that most edge systems operate under every day.
By building and running my own edge IoT gateway end-to-end, I was able to study where reliability, security and observability intersect in practice, not just in architecture diagrams.
Edge IoT Gateway Architecture
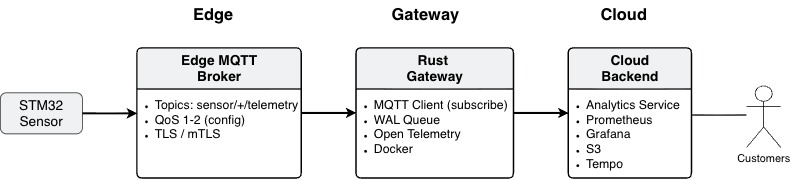
The Edge IoT Gateway is written in Rust and acts as a boundary component between constrained devices and cloud infrastructure.
Sensor data is published from the STM32 device to an edge-local MQTT broker over a secure TLS connection. The gateway subscribes to relevant topics via an MQTT client and ingest data into a write-ahead log (WAL), where messages are durably stored in a SQLite database before being forwarded downstream.
The gateway is instrumented using OpenTelemetry, exposing metrics and traces that are scraped by Prometheus and visualized in Grafana. This provides continuous visibility into ingestion rates, buffer depth, retries, replays, and delivery behavior.
A more detailed gateway architecture blog post are available on my personal blog.
What Failed (or Almost Did)
The first failures were not dramatic crashes, but configuration level issues.
Early on, the gateway failed to ingest data due to a type in a MQTT topic configuration and an incorrect SAN DNS entry in a certificate used for mutual TLS between the gateway and the edge MQTT broker. Both issues were simple, but representative of the kind of mistakes that routinely make it into production systems.
At the device level, the STM32 had issues when reconnecting to the MQTT broker after intentional shutdowns. The reconnect strategy attempted three retries before faulting and forcing a device restart. This behavior was acceptable in isolation, but highlighted how brittle reconnect logic can become without careful handling.
Finally, long-running operation exposed sensor drift. Running the device 24/7 caused internal temperature readings to stabilize 6-8°C higher than a cheap external reference sensor. The was not a software bug, but a physical reality that directly impacts data quality if left unaccounted for.
What Observability Revealed Early
Observability made these issues visible quickly and with low cognitive overhead.
Instead of relying on logs or manual probing, I could inspect dashboards to confirm whether data was flowing, whether ingestion was stalled, and whether duplicate messages were being replayed after reconnects. Metrics and traces provided a continuous view into system behavior while it was running, rather than after something had already gone wrong.
This significantly reduced debugging time and improved confidence in system behavior during changes and restarts. More importantly, it shifted the workflow from reactive debugging to continuous validation.
What Would Have Been Invisible Without It
Prior to introducing the gateway and its observability instrumentation, interacting with the device often felt like working a black box.
The device itself is hardened by default when running in production configurations, limiting introspection to protect against physical attacks. Without an intermediate observability layer, visibility was largely constrained to point-to-point communication and whatever signals the cloud platform exposed.
Without the gateway’s metrics and traces, subtle issues such as ingestion data gaps, replay behavior, or degraded sensor quality would have been difficult, if not impossible to detect early.
How This Maps to Client Audits
These lessons map directly to real-world IoT infrastructure audits.
Most issues uncovered during this experiment were not edge-case failures, but boundary problems: configuration drift, reconnect behavior, buffering assumptions, and missing observability at critical sections.
Auditing an IoT system early, before incidents occur, helps identify where these blind spots exist, how mature the security and observability posture is, and which risks are likely to surface first under real operating conditions.
This experiment reinforced a consistent pattern I see in production systems: the most costly failures are rarely the loud ones, they’re the silent ones you didn’t instrument for.