Overview
This case study documents a small indoor-climate monitoring system built around an IoT device using a STM32 B-L475E-IOT01A2 Arm® Cortex®, an external SCD41 CO2 sensor, MQTT transport, and an internal gateway and monitoring system.
The technical goal was straightforward: take a IoT board that already worked for basic room telemetry, add a CO2 sensor over I2C, preserve a modular firmware structure, and make sure the resulting signal stayed useful once it reached the monitoring layer.
The result is a compact edge-to-cloud path that can be inspected at each layer.
Problem context
Temperature and humidity alone can show that a room is drifting, but they do not explain whether the room is becoming unhealthy under occupancy or whether ventilation response is actually needed. For indoor-climate use cases, CO2 changes that interpretation.
The practical problem behind this work was not just adding CO2 as another sensor value. It was making the measurement useful across the full device-to-dashboard path:
- adding CO2 without tangling the embedded device code
- keeping the telemetry format understandable outside the board firmware
- surfacing readings and alerts in a way that helps diagnose real room behavior
- distinguishing real environmental drift from stale sensor data, weak thresholds, or pipeline issues
This is where many room-monitoring prototypes stop being operationally useful. They can produce values, but the readings often lack enough context to support decisions. A useful system needs to preserve the meaning of the measurement as it moves from the physical sensor, through firmware and transport, into storage, dashboards, and alerts.
System under test
The system in scope is intentionally small:
- STM32
B-L475E-IOT01A2room-health IoT device SCD41CO2 sensor connected overI2C- room-health readings published to
MQTT - Rust-based IoT Gateway carrying the message path
- Monitoring system evaluating room state and
CO2alarms configured through configuration files
The value of keeping the slice this small is that each part stays inspectable. It is possible to reason about the sensor integration, the publish path, and the monitor behavior without hiding behind embedded system complexity.
Device layer
STM32 + SCD41
The STM32 room node reads CO2 plus more precise temperature and humidity through an SCD41 sensor abstraction without changing the rest of the publish path.
Gateway layer
MQTT path stays simple
The same Rust IoT Gateway and MQTT path can carry the indoor-climate payload without sensor-specific branching in the transport layer.
Operator layer
Indoor health alarms
Monitoring system can now evaluate CO2 thresholds from configuration and turn the raw readings into visible indoor-air-quality alarms and follow-up actions.
Current room-state view
The initial monitoring view shows the current room-health state for one device. That matters because room telemetry is only useful when the latest reading, freshness, and recent trend can be seen together.
In this setup, the room-state panel carries:
- current temperature, humidity, and
CO2 - freshness status for the latest sample
- one-hour, 24-hour, and 7-day traces for fast inspection
- a health band that tells the operator whether the room is inside the intended range
- room identity preserved from device to monitor
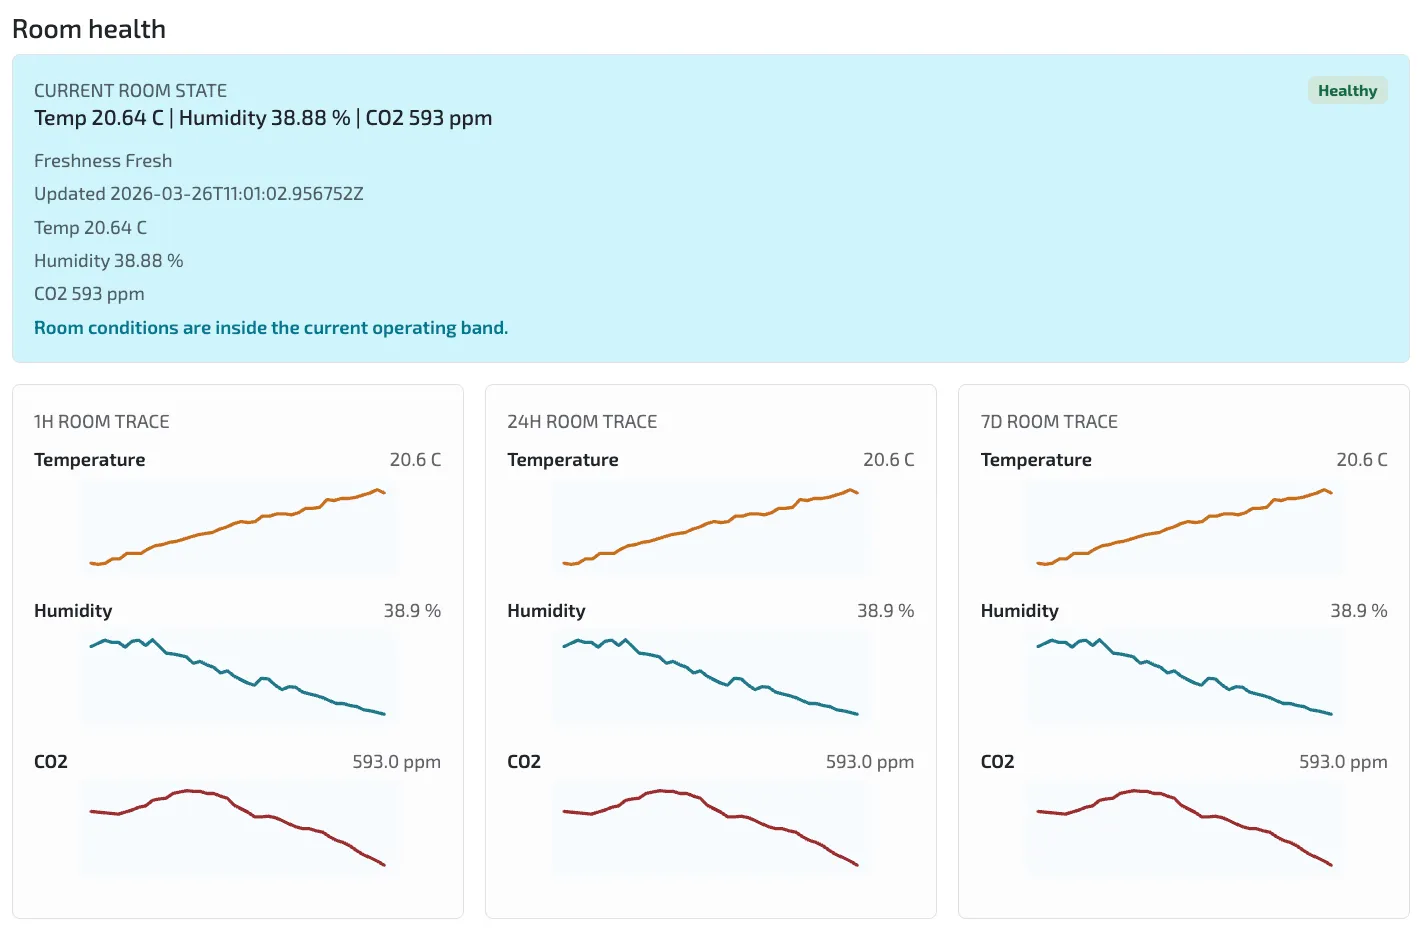
Image description: The room-health view shows one STM32 device reporting fresh temperature, humidity, and CO2 data, with short and long traces available in the same operational panel.
For an engineer, the useful part is not that the dashboard says “Healthy.” The useful part is that one dashboard panel combines current values with recent history. That makes it easier to tell whether the room is actually stable, whether CO2 is rising because people are present, or whether the signal quality itself needs investigation.
This is also where the extra sensor dimension matters. Temperature and humidity trends are still visible, but CO2 gives the system a better indoor-air-quality signal than a temperature-only interpretation.
Telemetry history, trust, and corrected temperature
The telemetry-history dashboard view separates three questions that otherwise get mixed together:
- is the device still publishing fresh samples?
- what did the
CO2trend actually do during the selected window? - how should temperature be interpreted when the board sits in a printed enclosure?
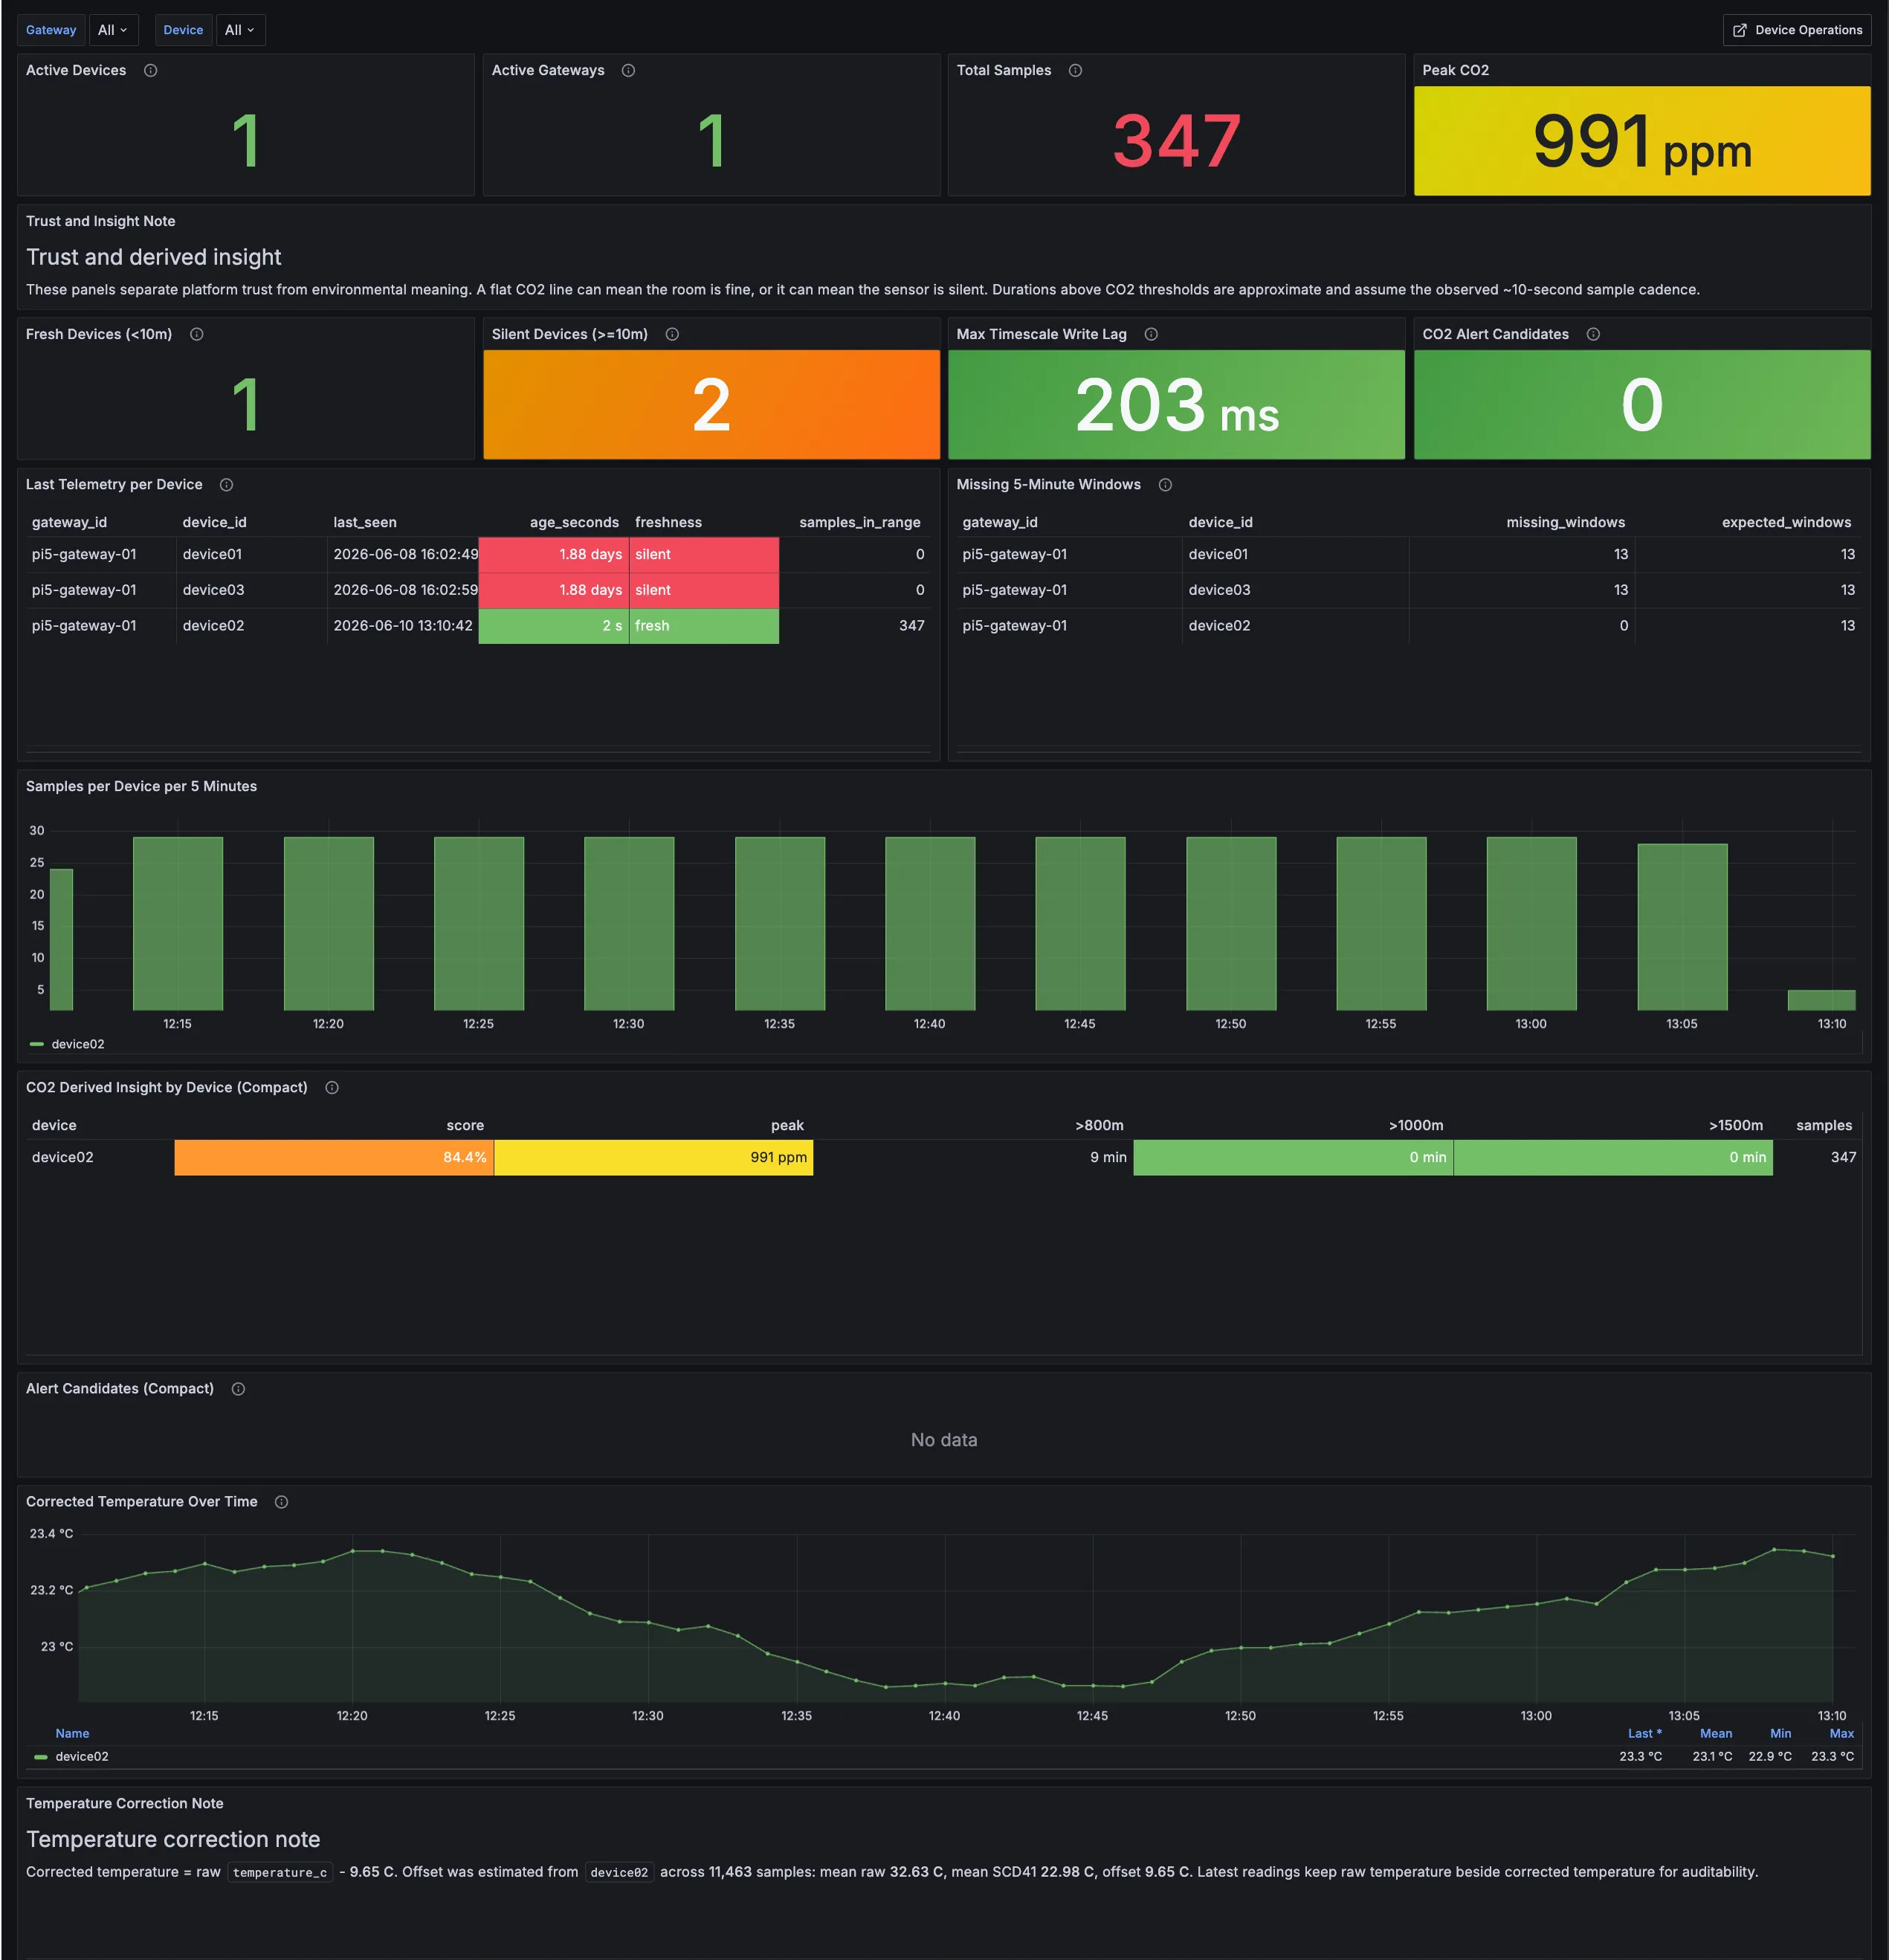
Image description: The first telemetry-history screenshot shows the trust layer around the room-health stream: one fresh device, two silent devices from the wider fleet, 347 samples in range, peak CO2 at 991 ppm, no current CO2 alert candidates, and corrected temperature displayed beside the freshness and sample-coverage panels.
The corrected-temperature panel is included because this device is now running inside a 3D printed enclosure. The enclosure makes the device easier to handle and place, but it also changes how raw board temperature should be interpreted. In this run, the monitor keeps the raw STM32 temperature, the SCD41 temperature, and a corrected temperature side by side so the adjustment stays auditable instead of becoming a hidden dashboard tweak.
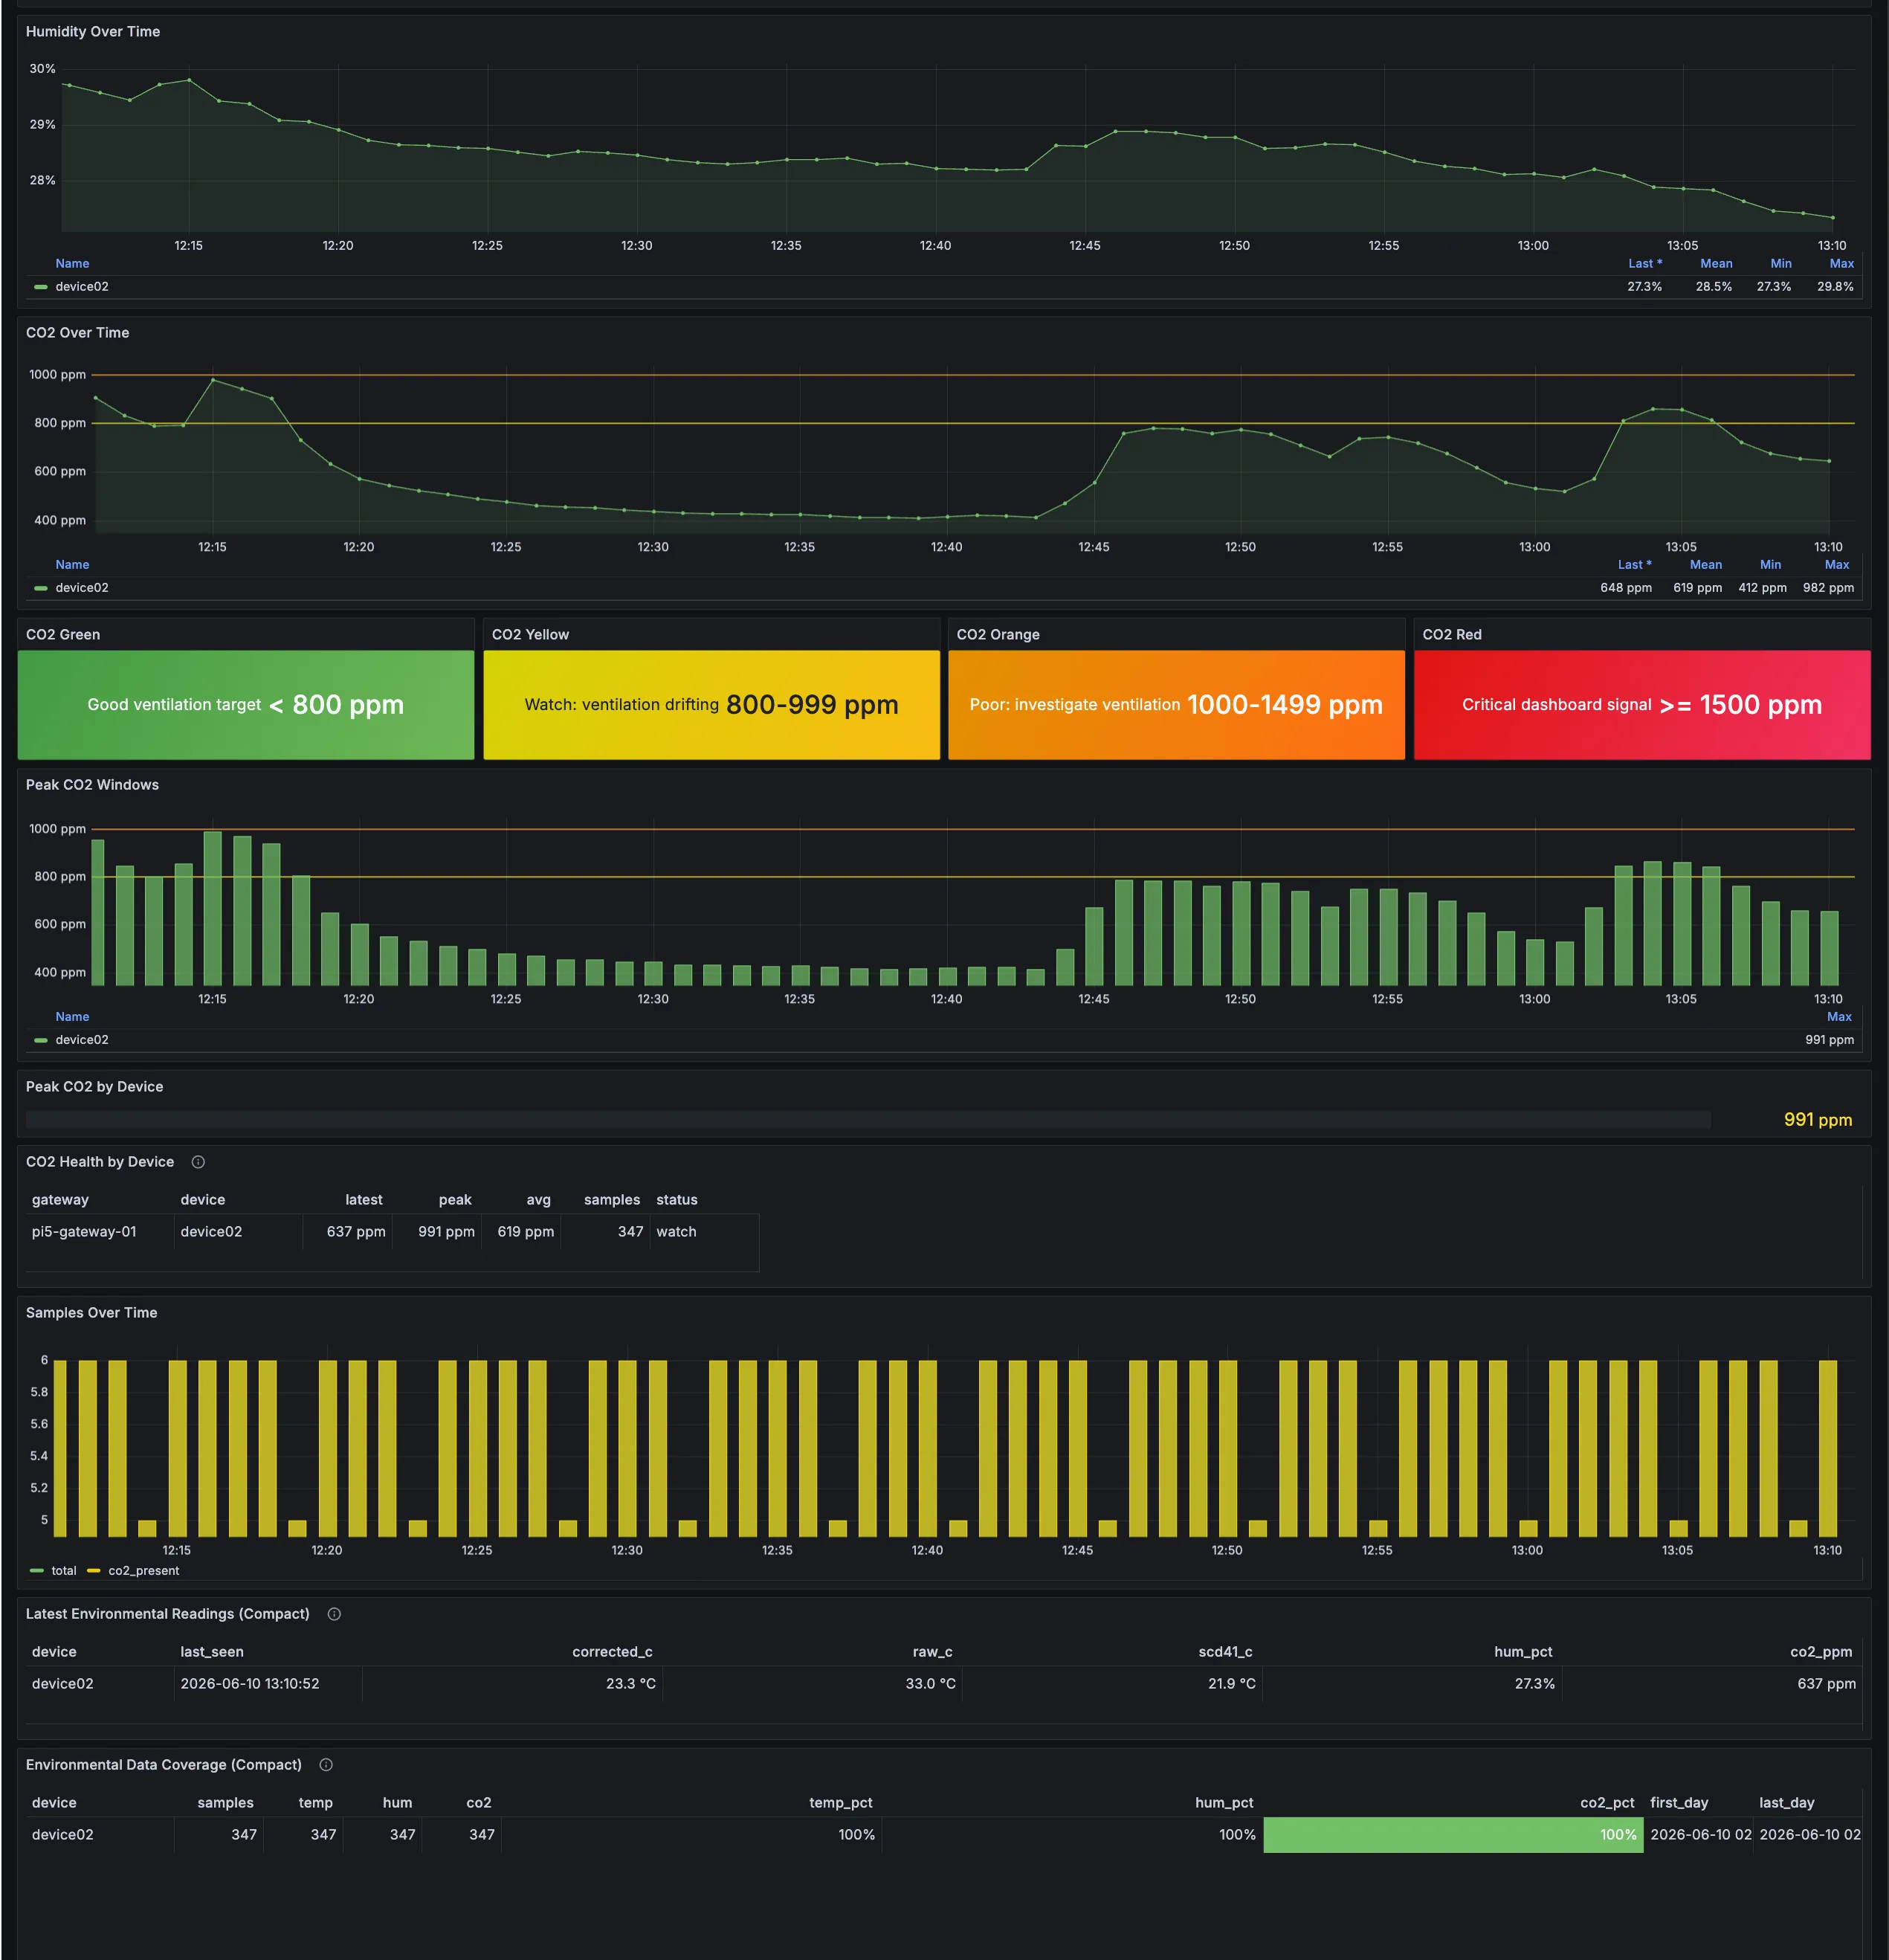
Image description: The second telemetry-history screenshot shows the operational signal behind the summary: humidity and CO2 trends, green/yellow/orange/red CO2 bands, peak CO2 windows, latest environmental readings with raw, corrected, and SCD41 temperature values, and 100% coverage for temperature, humidity, and CO2 samples during the selected period.
For this case study, the important point is not that the correction is final calibration. It is that the system now preserves enough context to compare readings and tune the interpretation over time. That is the difference between a value being merely visible and a value being useful as engineering evidence.
Alert history and failure modes
The alert history view is where the setup becomes easier for operators to debug and fine tune the system.
Instead of showing only the latest sensor values in a dashboard, the monitoring systems records explicit events with timestamped context. In the current setup, the event list captures several different classes of room-health behavior:
- recovered
high CO2alerts with ppm context - recovered
high-temperature warningswith Celsius context - stale-sensor warnings when the freshness story degrades
- timestamped evidence that can support incident review, threshold tuning, and rule refinement
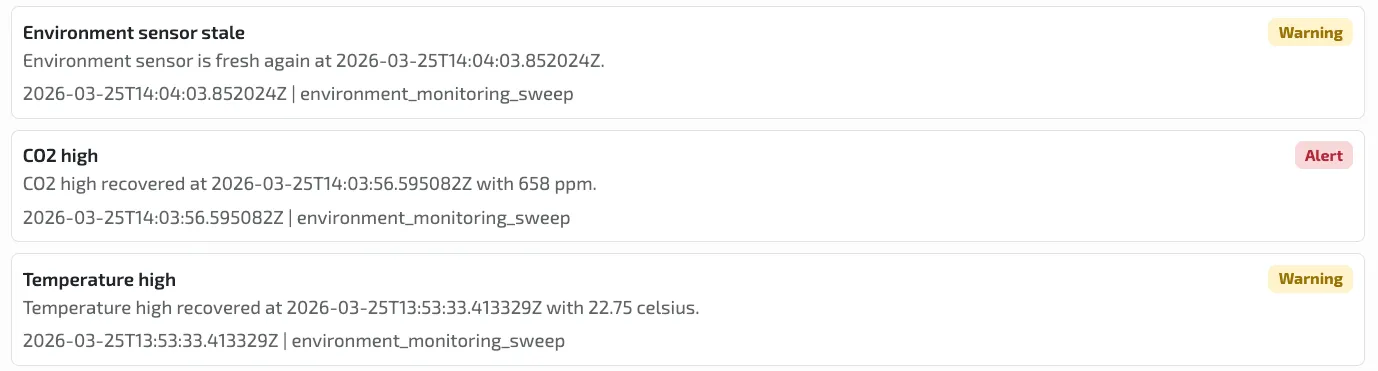
Image description: The updated alert history shows that the same room-health path can surface CO2, temperature, and freshness events as explicit monitor evidence instead of leaving the operator to infer them from raw values.
This matters because a bad indoor-climate reading can have several different causes:
- the CO2 level may actually be rising because people are in the room
- temperature or humidity may show that the room is changing over time
- the sensor may have stopped sending fresh data
- the alert threshold may simply be too sensitive or too weak
The alert history helps separate these cases. Instead of only seeing a number on a dashboard, the operator can see what happened, when it happened, and whether the system later recovered.
How the STM32 SCD4x integration was done
The device is built around STM32 B-L475E-IOT01A2. The main firmware change was adding an external SCD41 CO2 sensor on the device side while keeping the integration modular. The module shown here is the SCD41, which sits inside the broader SCD4x sensor family.
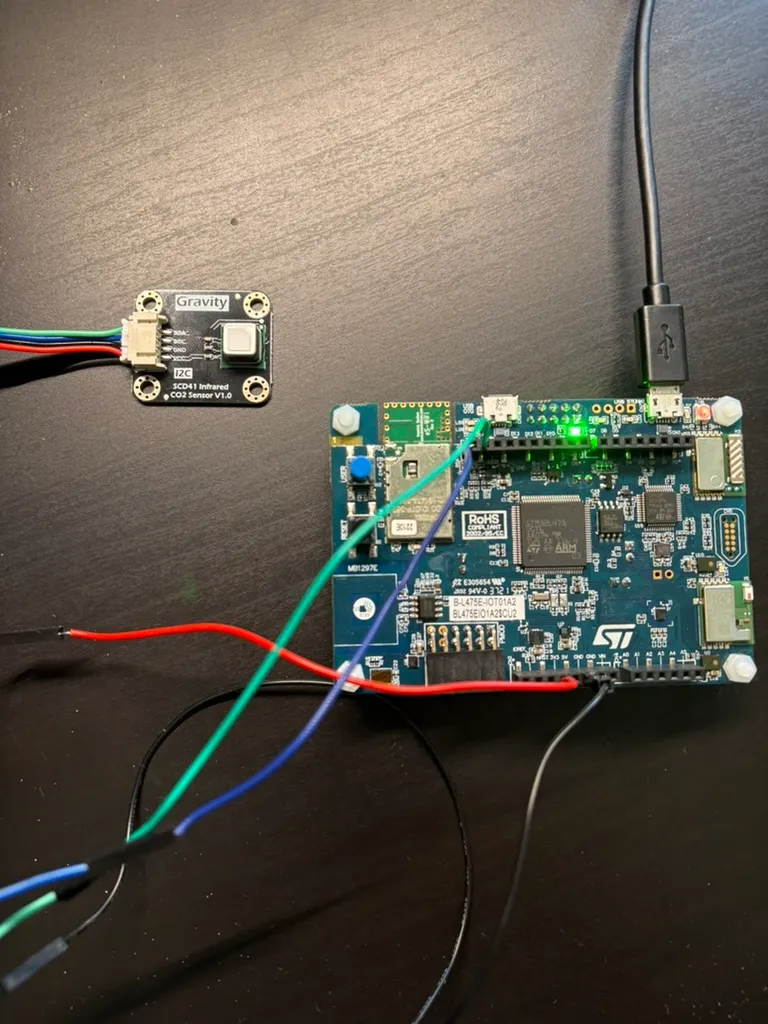
Image description: The integrated device photo shows the STM32 B-L475E-IOT01A2 board physically wired to the SCD41 CO2 sensor module. It provides the board-level context behind the room-health readings shown in the monitor screenshots.
At a high level, the integration looks like this:
- the
SCD41module is connected to the STM32 overI2C - a modular sensor abstraction reads the sensor and normalizes the sample into room-health fields
- the device publish layer reuses that normalized sample when it sends
CO2, temperature, and humidity toMQTT - the downstream gateway and monitor can keep working with the same transport and asset model
That split keeps the responsibilities clear:
- firmware owns sensor access and payload formation
- the gateway owns message transport
- the monitor owns threshold logic and alert presentation
The practical benefit is that the device can evolve from onboard humidity sensing into a fuller indoor-air-quality node without rewriting the rest of the telemetry chain.
The firmware integration keeps the add-on sensor optional. That was a deliberate design choice, not just defensive coding. The STM32 board already had a working baseline telemetry loop, so the CO2 work needed to extend that loop without making the whole device depend on one external module being connected, warmed up, and ready at every publish interval.
The project treats the SCD41 as a small sensor wrapper around the lower-level I2C driver, then lets the telemetry builder decide whether a fresh sample is available. If the SCD41 path is not ready, the payload still carries the base board readings and marks the SCD41-derived fields as null. If the read succeeds, the same payload shape gains co2, scd41_temperature, and scd41_humidity:
SCD4X_Measurement_t sample = {0U, 0.0f, 0.0f};
char co2_text[16];
char scd41_temperature_text[24];
char scd41_humidity_text[24];

if (read_scd41_measurement(&sample) == SENSOR_OK)
{
  snprintf(co2_text, sizeof(co2_text), "%u", sample.co2_ppm);
  snprintf(scd41_temperature_text, sizeof(scd41_temperature_text), "%.2f", sample.temperature_c);
  snprintf(scd41_humidity_text, sizeof(scd41_humidity_text), "%.2f", sample.humidity_percent);
}
else
{
  snprintf(co2_text, sizeof(co2_text), "null");
  snprintf(scd41_temperature_text, sizeof(scd41_temperature_text), "null");
  snprintf(scd41_humidity_text, sizeof(scd41_humidity_text), "null");
}
The important shape is the boundary, not the exact function names: I2C sensor work stays on the STM32 side, the published telemetry remains predictable, and the monitor can compare the onboard temperature, SCD41 temperature, corrected temperature, humidity, and CO2 without special-casing transport.
The lower-level setup is still worth showing because this is where hardware integration becomes concrete. The external sensor uses a dedicated I2C1 path on the STM32 header instead of being folded into the rest of the telemetry code. In practical terms:
PB8is used asI2C1SCLPB9is used asI2C1SDA- the GPIO port clock is enabled before the pins are configured
- both pins are configured as alternate-function, open-drain GPIO for
I2C1 - the
I2C1peripheral clock is enabled and reset beforeHAL_I2C_Init - the SCD4x driver receives a small bus-IO table with init, read, write, tick, and delay callbacks
#define ROOM_CO2_I2C_INSTANCE I2C1
#define ROOM_CO2_SCL_PIN      GPIO_PIN_8
#define ROOM_CO2_SDA_PIN      GPIO_PIN_9
#define ROOM_CO2_GPIO_PORT    GPIOB
#define ROOM_CO2_GPIO_AF      GPIO_AF4_I2C1

static I2C_HandleTypeDef room_co2_i2c;

static int32_t room_co2_i2c_init(void)
{
  GPIO_InitTypeDef gpio = {0};

  __HAL_RCC_GPIOB_CLK_ENABLE();
  __HAL_RCC_I2C1_CLK_ENABLE();

  gpio.Pin = ROOM_CO2_SCL_PIN | ROOM_CO2_SDA_PIN;
  gpio.Mode = GPIO_MODE_AF_OD;
  gpio.Pull = GPIO_NOPULL;
  gpio.Speed = GPIO_SPEED_FREQ_HIGH;
  gpio.Alternate = ROOM_CO2_GPIO_AF;
  HAL_GPIO_Init(ROOM_CO2_GPIO_PORT, &gpio);

  __HAL_RCC_I2C1_FORCE_RESET();
  __HAL_RCC_I2C1_RELEASE_RESET();

  room_co2_i2c.Instance = ROOM_CO2_I2C_INSTANCE;
  room_co2_i2c.Init.AddressingMode = I2C_ADDRESSINGMODE_7BIT;
  room_co2_i2c.Init.Timing = room_co2_i2c_timing_100khz();

  return HAL_I2C_Init(&room_co2_i2c) == HAL_OK ? SENSOR_OK : SENSOR_BUS_ERROR;
}
The SCD4x-specific code then sits one layer above that bus setup. It does not need to know about the dashboard, MQTT topic, or alert thresholds. It only needs a way to initialize the bus, send commands, read bytes, and wait between sensor operations:
SCD4X_IO_t bus = {
  .Init = room_co2_i2c_init,
  .Write = room_co2_i2c_write,
  .Read = room_co2_i2c_read,
  .GetTick = board_get_tick,
  .Delay = board_delay_ms,
};

register_scd4x_bus(&room_co2_sensor, &bus);
start_periodic_measurement(&room_co2_sensor);
That layering is what keeps the project understandable: pin setup and I2C timing live in the board integration layer, SCD41 commands live in the sensor wrapper, and the publish path only sees normalized room-health fields.
Sensor and transport notes
The sensor choice matters because the room-health story is no longer limited to temperature. By adding the SCD41, the system gets a direct CO2 signal, along with temperature and humidity readings that help describe the indoor environment more clearly.
At a system level, the data path stays simple:
- the
STM32device firmware reads theSCD41overI2C - the device publishes a room-health payload over
MQTT - the Rust gateway carries the edge-to-cloud path
- indoor-climate alert thresholds are configured in
application.conf
This keeps the device firmware focused on reading sensors and publishing measurements. The monitoring layer is responsible for deciding when a value becomes operationally interesting.
That separation matters in practice. If a room, office, lab, cabinet, or meeting space needs different thresholds, the rules can be adjusted in configuration instead of requiring a firmware change and device redeploy.
That is a more practical operating model than hardcoding every room-specific rule into the IoT device firmware.
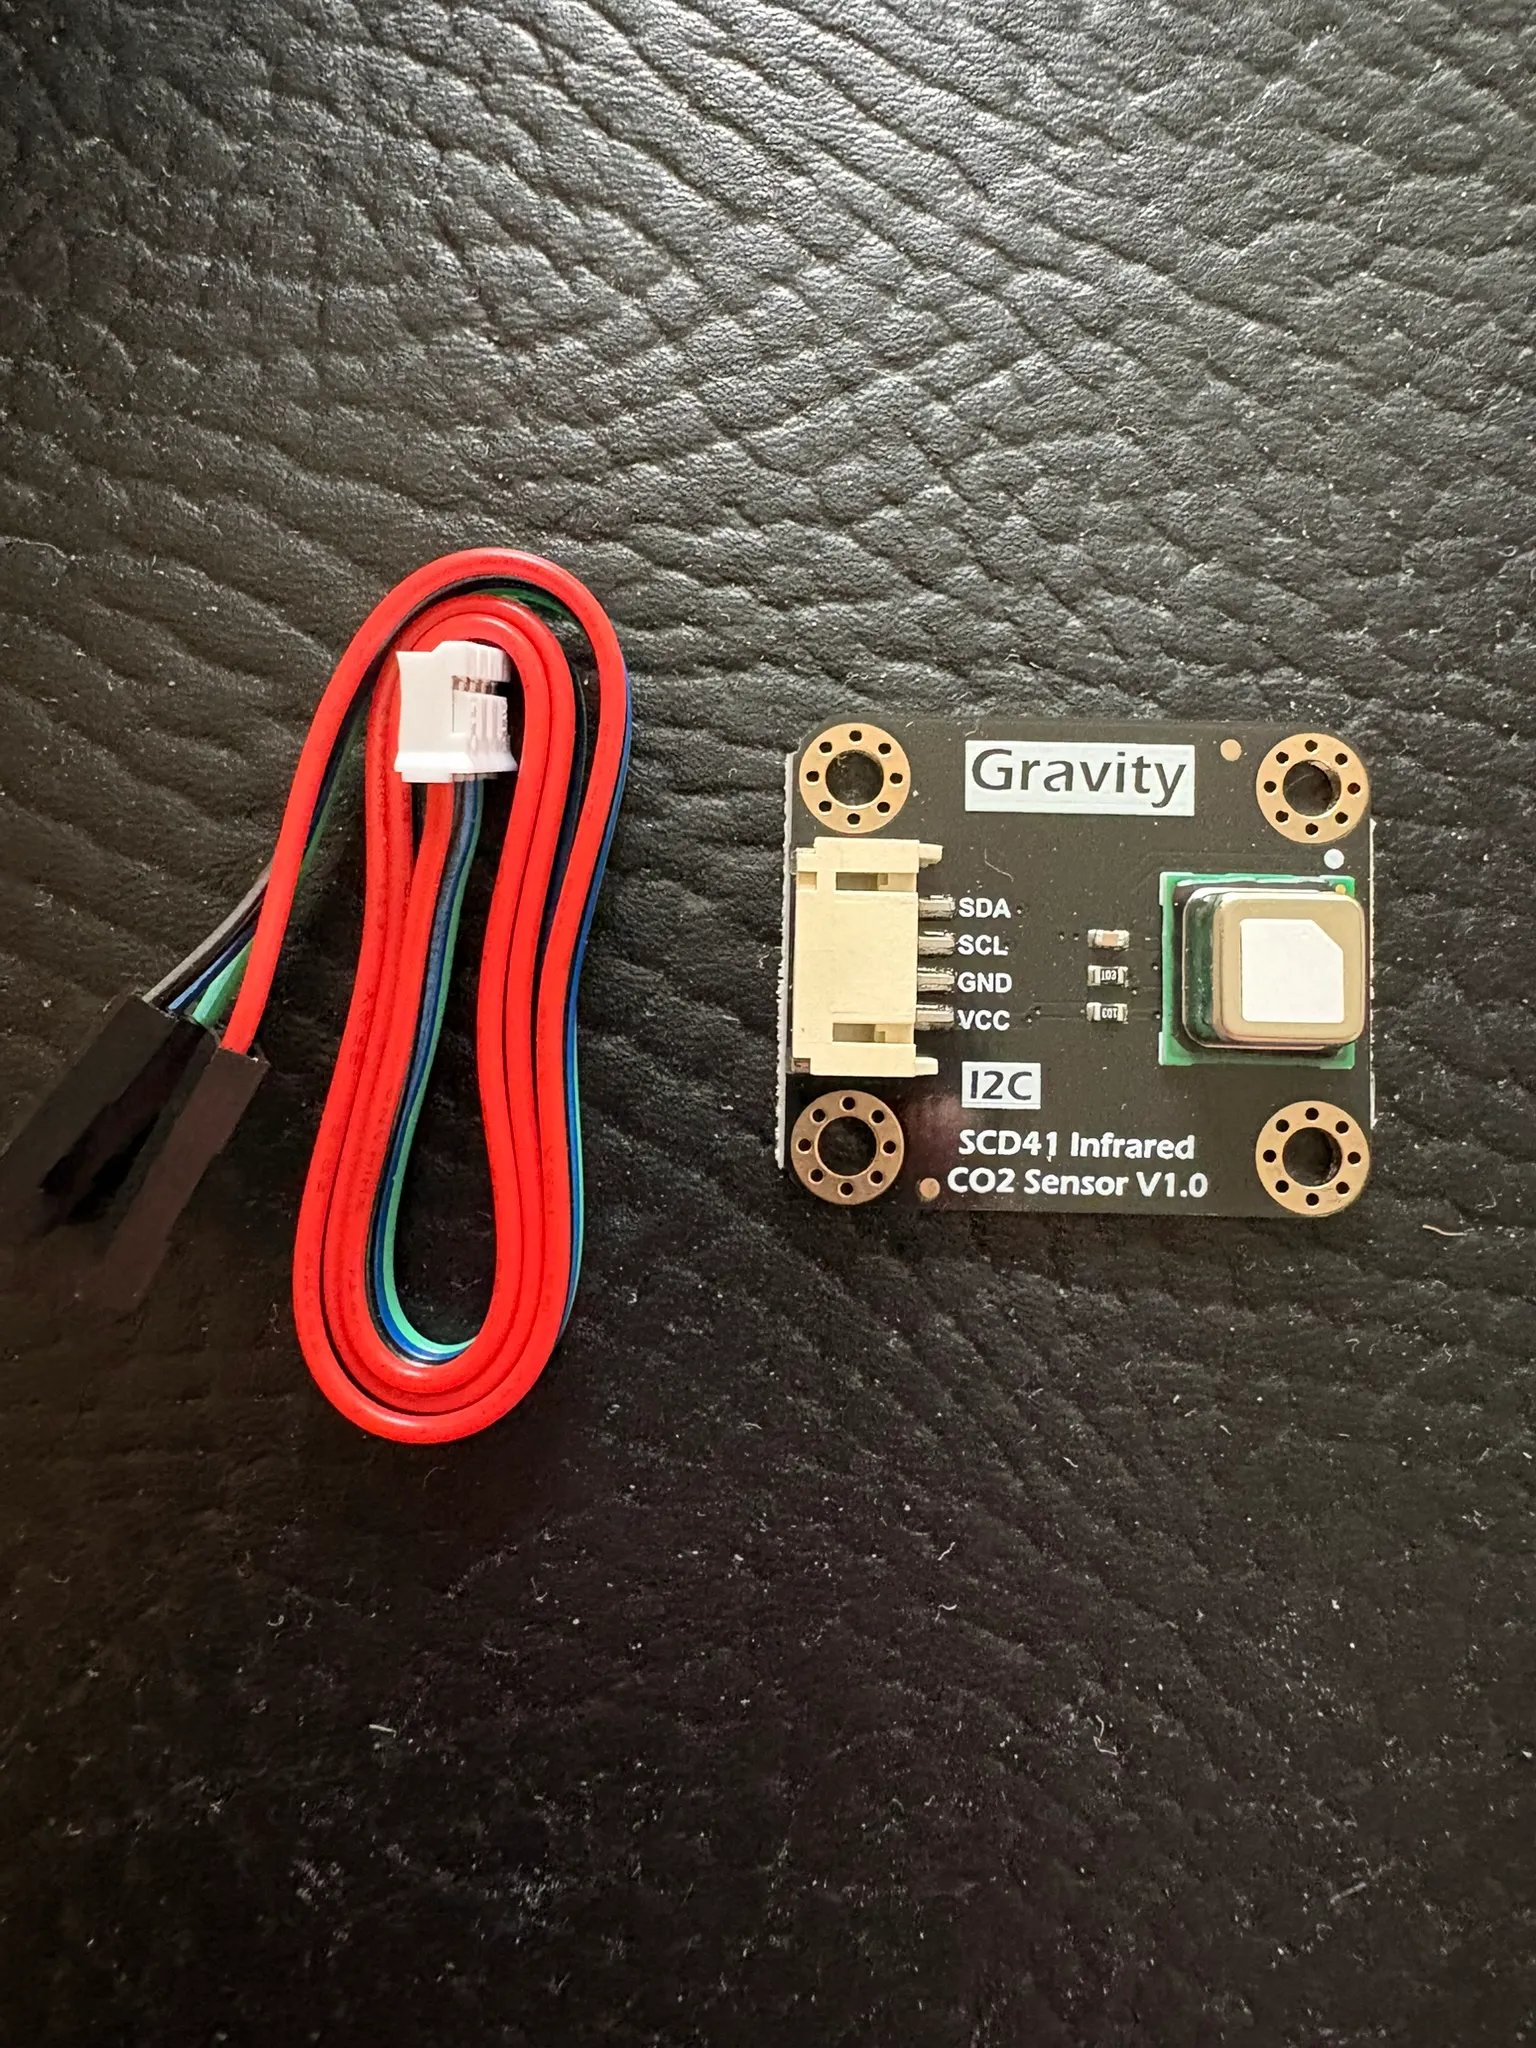
Image description: The SCD4x family sensor module adds CO2 sensing plus temperature and humidity support to the STM32 room-health setup through an I2C-connected, modular device integration.
Alarm handling
The CO2 alarm policy is not buried in the device firmware. The STM32 publishes measurements upstream, and the monitoring layer evaluates indoor-climate thresholds from application.conf.
That gives the team room to:
- tune indoor-air-quality thresholds for each room or deployment
- adjust alarm messages without changing the sensor driver
- inspect whether the problem is a real room-health event or a telemetry-quality issue
- reuse the same signal as input for audit findings, hardening work, and operational review
This is a cleaner operational split than hardcoding every indoor-climate decision into the device. The firmware stays focused on measurement and publishing. The monitoring layer owns interpretation, thresholds, and alert behavior.
Practical takeaways
For readers working on similar systems, the most useful parts of this setup are:
- the board-level sensor integration is simple enough to understand and extend
- the telemetry path remains easy to inspect after adding a new sensor
- tthe monitor shows both current room state and recent alert history
CO2adds a more useful indoor-air-quality signal than temperature and humidity alone- configuration-driven alarms make the system easier to adapt across environments
In other words, the work adds value at two levels. It improves the device by adding a better sensor signal, and it improves operations by making that signal easier to interpret, tune, and trust once it reaches the monitoring layer.
Where this pattern is useful
This pattern is useful when:
- a team needs a believable
STM32toMQTTto monitor slice before rollout - room, office, lab, or enclosure telemetry is visible but not decision-ready
- indoor-air-quality alarms exist, but do not carry enough context to trust them
- sensor integration must stay modular instead of being hard-wired through the full stack
- dashboards show symptoms, but not enough context to decide the next step
The main benefit is that the system does not stop at “we can read sensor values.” It creates a path from physical measurement to operational evidence. That makes it easier to decide whether the next action is threshold tuning, firmware refinement, sensor investigation, or a deeper review of the telemetry path.
Next step
If you are building a similar indoor-climate path, start with one device, one sensor path, and one monitor view you can verify end to end.
That usually exposes the real questions faster: whether the readings stay fresh, whether the threshold logic is sensible, whether the device payload is shaped well enough for monitoring, and whether the room-health story still makes sense once it leaves the board.